Your logs arrive late in your microserviced application. Someone cannot see recent application logs in kibana. Why is that? Here's why TTY detection and multiple buffering layers cause this and recipe to fix.
Your Kibana/Cloudwatch/Grafana have different timestamps, you don’t see recent logs from your application. Why is that? You may ask. Some QA reports that your application is not working/was not deployed, asking you to review the deploy process. Or even worse: asking your devops colleagues to “something went wrong” with last deployment could you check?
You login into your shell running kubectl get pods to verify timestamps update or checking Helm releases helm ls. But everything seems fine, everything deployed. CI/CD is green, all timestamps updated. But yet. QA does not see the logs. Where have they gone?
You’re running a Rails app. On localhost, logs appear instantly. You deploy to Docker/Kubernetes, and suddenly:
- Logs arrive in Kibana late (sometimes significantly like 30m)
- Timestamps don’t match when events actually happened
- Log order is scrambled across pods
What changed? You didn’t touch the logging code in your last deployment!
The problem is internal buffering of ruby logger (you could also have same issue if writing logs to a file on localhost)
You may be mislead by the fact that
STDERR is unbuffered. So you see errors immediately, but that’s not the default rule for the STDOUT (info/debug/warn) level. Only error/fatal are flushed right away.
The problem is rare seen on production (because logs run faster, and buffer is filled fast reducing IO operations). But it seen often on less loaded instances like test/staging/pre-prod/feature-env. So the actual log may sit inside buffer for some amount of time, misleading others who can’t see the logs.
The Root Cause: TTY Detection
When Ruby (and most languages using libc) write to stdout, the buffering behavior depends on whether stdout is connected to a TTY (terminal) or not:
| Environment | stdout connected to | Buffering Mode | Buffer Size |
|---|---|---|---|
| Your terminal | TTY (interactive) | Line-buffered | Flush on \n |
| Docker container | Pipe/File | Block-buffered | 4KB - 64KB |
On localhost with rails server:
Ruby process → stdout (TTY) → Your terminal
                    ↑
            Line-buffered: flushes on every newline
            You see logs INSTANTLY
In Docker container:
Ruby process → stdout (pipe) → Docker daemon → JSON log file → Filebeat(promtail) → Loki → Elasticsearch → Kibana
                    ↑
            Block-buffered: waits until buffer is full (4-16KB) depends on environment
            or process exits, or explicit flush
The Technical Details: Buffer Layers
There are actually separate buffer layers, each with its own size:
Layer 1: C Library (libc/glibc) stdio buffer
Ruby’s IO is built on top of C’s stdio. The C library checks isatty(fd):1
// Pseudocode for simplicity
// if connected to tty, then \n return logs, otherwise fill the buffer
if (isatty(STDOUT_FILENO)) {
    setvbuf(stdout, NULL, _IOLBF, 0);
} else {
    setvbuf(stdout, NULL, _IOFBF, 8192);
}
Default buffer:2
- Linux glibc: block buffer for non-TTY
_IOFBF - TTY: Line-buffered (flush on
\n)_IOLBF
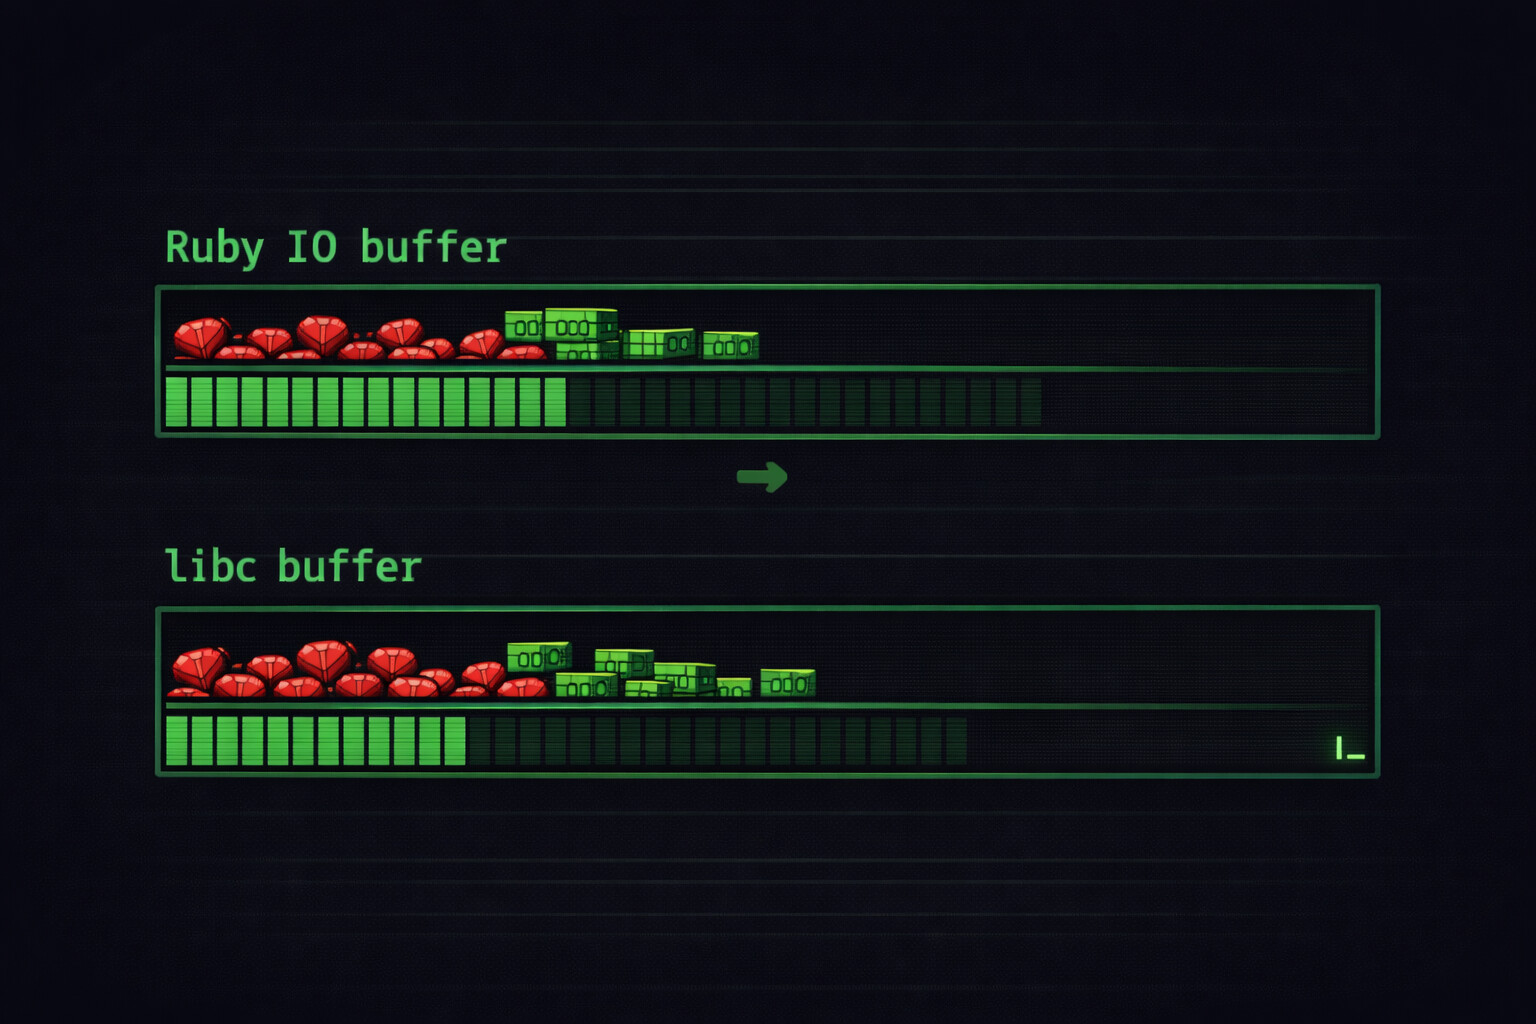
Layer 2: Ruby IO buffer
Ruby adds its own buffering on top. When you create an IO object:
fd = IO.sysopen('/proc/1/fd/1', 'wb') # PID 1's stdout in the container, main in docker
io = IO.new(fd, 'wb')
# Ruby allocates internal buffer, depends on IO whether it is tty/file/stream
# io.sync = false by default (buffered)
What’s going inside
Let’s examine the following code snippet
$stdout.sync = true
logger = Logger.new($stdout)
logger.info("Hello world!")
Here’s what happens under the hood:
logger.info("Hello world!")
    ↓
Logger formats message
    ↓
Logger writes to IO (Ruby buffer) ← io.sync=true skips this
    ↓
Ruby writes to libc buffer
    ↓
libc writes to kernel pipe buffer
    ↓
Docker daemon reads pipe
    ↓
...
eventually reaches Kibana
Buffer Sizes Summary
| Layer | Default Size | TTY Behavior | How to Disable |
|---|---|---|---|
| Ruby IO | 8-16KB | Inherits from FD | io.sync = true |
| Kernel pipe | 64KB (Linux) | N/A | Cannot disable, but flushes help |
| Docker log driver | Varies | N/A | Driver-specific config |
Full picture
┌─────────────────────────────────────────────────────────────────┐
│ Container                                                       │
│  ┌─────────┐    ┌─────────┐                                     │
│  │  Ruby   │ →  │  libc   │ → stdout (pipe)                     │
│  │ buffer  │    │ buffer  │                                     │
│  └─────────┘    └─────────┘                                     │
└─────────────────────────────────────────────────────────────────┘
                              ↓
┌─────────────────────────────────────────────────────────────────┐
│ Docker Daemon                                                   │
│  Reads from container stdout pipe                               │
│  Writes to: /var/lib/docker/containers/<id>/<id>-json.log       │
└─────────────────────────────────────────────────────────────────┘
                              ↓
┌─────────────────────────────────────────────────────────────────┐
│ Filebeat / Fluentd / Logstash                                   │
│  Tails the JSON log file                                        │
│  Has its own flush interval                                     │
└─────────────────────────────────────────────────────────────────┘
                              ↓
┌─────────────────────────────────────────────────────────────────┐
│ Elasticsearch                                                   │
│  Index refresh interval                                         │
└─────────────────────────────────────────────────────────────────┘
                              ↓
┌─────────────────────────────────────────────────────────────────┐
│ Kibana                                                          │
│  You finally see the log                                        │
└─────────────────────────────────────────────────────────────────┘
Each step adds latency. But the biggest variable delay is at the top: your application’s buffering. That’s the part that can hold logs for significant time if the buffer doesn’t fill up.
How To Fix
The fix is easy and straightforward already mentioned the option for ruby logger buffering sync method
# STDOUT => #<IO:<STDOUT>>
STDOUT.sync = true
# or
$stdout.sync = true